
Observability is defined as the ability to measure a system’s current state based on the output data (such as logs, metrics, and traces) it generates.
Observability is being used more frequently to boost distributed IT system performance. It uses metrics, logs, and traces as three different telemetry data to provide deep visibility into distributed systems, enabling DevOps engineers to solve a wide range of problems and enhance system performance.
If you still don’t understand what is Observability, then let’s put it for you this way;
Observability is tooling or a technical solution that allows teams to debug their system actively. Observability is based on exploring properties and patterns not defined in advance.
Why is Observability Important?
Thanks to Observability, cross-functional teams who work on highly distributed systems, especially in an enterprise environment, can react more quickly and effectively to precise queries.
One can identify what’s slowing down the application’s performance and work towards fixing it before it impacts the overall performance or leads to downtown.
The benefits of Observability extend beyond IT use cases. When you gather and examine observability data, you have a window into the effects your digital services are having on your organization. This access allows you to monitor the results of your user experience SLOs, check that software releases fulfil business goals, and prioritize business choices based on what matters most.
Difference Between Observability v/s Monitoring
It’s really important for junior-level DevOps or someone who has just started their way into SRE to thoroughly understand the difference between Observability v/s Monitoring.
Here is what DORA’s research says about observability & monitoring.
Monitoring is tooling or a technical solution that allows teams to watch and understand the state of their systems. Monitoring is based on gathering predefined sets of metrics or logs.
Observability is tooling or a technical solution that allows teams to actively debug their system. Observability is based on exploring properties and patterns not defined in advance.devops-research.com
The ability to identify the internal state of a system using external data outputs is defined as Observability.
In the context of the IT industry, one can understand Observability as the ability to comprehend the internal state of software using logs, metrics, and traces.
Meanwhile, monitoring can be understood as the procedure to get the data (logs, metrics, and traces) from the system.
Most monitoring tools offer a drag-and-drop dashboard to display your chosen data and their respective metrics. However, this poses a major drawback because since the team usually builds such dashboards according to their preferences, it leads to a lack of important metrics, performance irregularities, and missing data.
Secondly, most of the monitoring tools aren’t compatible with monitoring complex, cloud-native applications, and containerized environments, either because of security issues or lack of ability of the agent to pull data.
In contrast, observability tools are much more compatible because they focus on logs, traces, and metrics gathered throughout your entire infrastructure to alert DevOps engineers before an issue can become a problem.
Simply put, monitoring tells you that a system has failed, and Observability helps you find out why that system failed.
What are the Benefits of Observability
Observability offers significant advantages to end users, enterprises, and IT teams. The following are significant benefits and why Observability matters:
- Application performance monitoring: Complete end-to-end Observability enables businesses to identify performance problems considerably more quickly, even those brought on by cloud-native and microservices architectures. More tasks can be automated with the use of an advanced observability solution, which will boost productivity and creativity among the Ops and Apps teams.
- DevSecOps and SRE: Observability is a fundamental characteristic of an application and the infrastructure that supports it, not only the outcome of implementing innovative tools. The software’s designers and developers must make it easy to observe. Then, during the software delivery life cycle, DevSecOps and SRE teams may use and understand the observable data to create stronger, more secure, and more resilient apps.
- Monitoring for infrastructure, the cloud, and Kubernetes: One of the several benefits of using observability is that it helps with Infrastructure monitoring. It enables Infrastructure and operations (I&O) teams can take advantage of the improved context an observability solution offers to increase application uptime and performance, reduce the time needed to identify and fix problems, detect cloud latency issues and optimize resource utilization to improve the administration of their Kubernetes environments & contemporary cloud architectures.
- End-user experience: A positive user experience can boost a business’s reputation and income, giving it a competitive advantage. Companies can increase customer satisfaction and retention by identifying and fixing problems before the end user recognizes them and implementing improvements before they are even requested.
What are the Main Components of Observability?
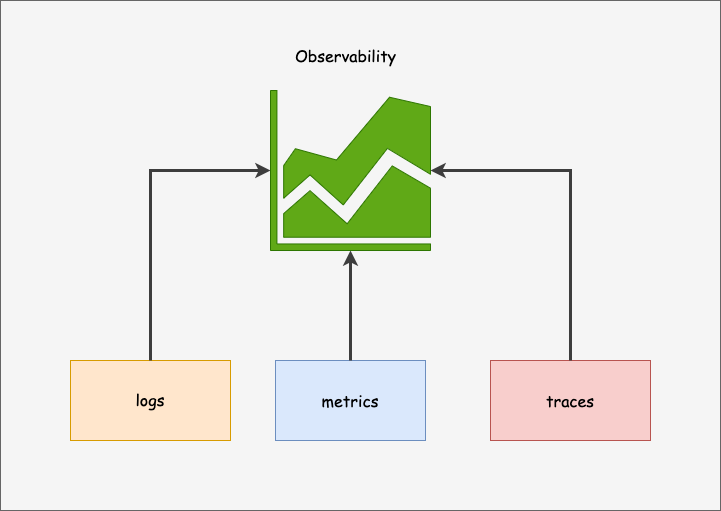
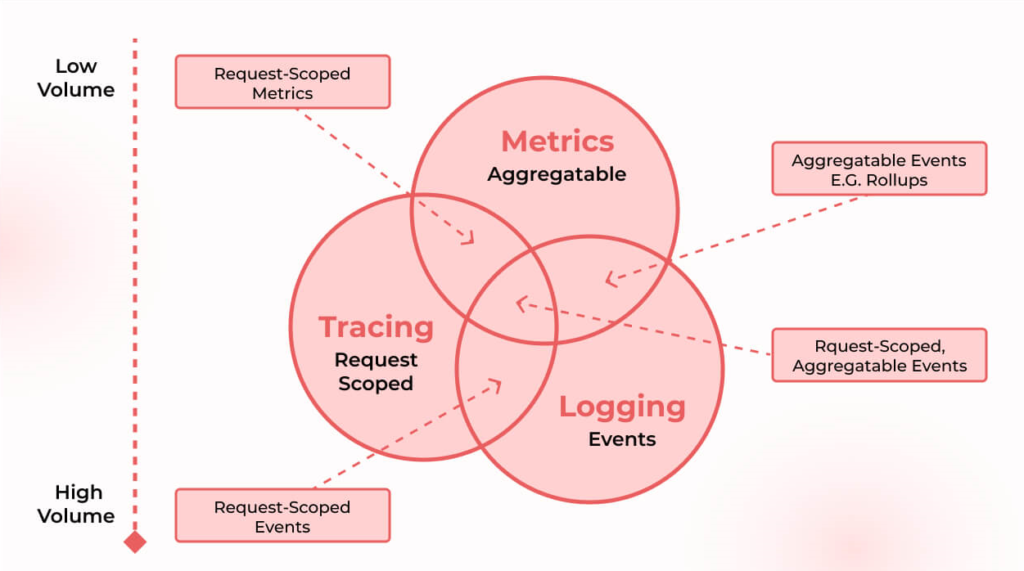
Metrics, logs, and distributed traces are the three main verticals of Observability; these are also known as the “three pillars of observability.” The three observability pillars are several ways to monitor software systems, particularly microservices. Event logs, metrics, and traces are observability pillars that can be used separately.
The productivity of DevOps teams will be considerably increased by combining the three pillars rather than using them separately, and your users will have a better experience interacting with your system.
Logs
A log records an event in your software with a time stamp. The data in this record is the most detailed information of the three pillars. Developers are responsible for logging in code. Since most software libraries and languages have built-in functionality, logs are simple to implement.
When it comes to offering insightful information and ample context into the long tail that averages and percentiles don’t emerge, event logs excel. Event logs are, therefore, particularly useful for identifying emergent and unanticipated behaviours displayed by parts of a distributed system.
Metrics
Data measured over a period of time is represented numerically by metrics. Metrics can take advantage of mathematical modelling and prediction capacity to learn more about how a system behaves over time intervals in the present and the future.
Because metrics are optimized for storage, processing, compression, and retrieval, they allow for extended data retention and simpler querying. Metrics are thus ideal for creating dashboards that show historical patterns. The resolution of the data can also be gradually decreased using metrics. Data can be aggregated into daily or weekly frequency after a specified time.
Traces
The end-to-end request flow through a distributed system is encoded in a trace, representing a sequence of causally connected distributed events.
The data structure of traces resembles that of an event log; they represent logs. A single trace can give insight into a request’s structure and the path it took to get there. The structure of a request aids in understanding the junctures and impacts of asynchrony in executing a request, and the path of a request enables software engineers and SREs to comprehend the various services engaged in the course of a request.
It is possible to debug requests involving multiple services to identify the cause of increased latency or resource usage by thoroughly understanding the entire request lifecycle.
How Does Observability Work?
Observability platforms continuously identify and gather performance telemetry by integrating existing instrumentation embedded into application and infrastructure components and offering tools to add instrumentation to these components.
Most of the platform gathers metrics, traces, and logs. And then, connect them in real-time to provide DevOps teams, site reliability engineering (SRE) teams, and IT personnel with thorough contextual information — the what, where, and why of every event that can indicate, contribute to, or be used to address an application performance issue.
What are the Challenges of Observability?
Although Observability has always been difficult, the complexity of clouds and the quickening of change have made it vital for enterprises to address. Cloud systems produce much higher telemetry data when microservices and containerized applications are involved. Additionally, they generate a much more comprehensive range of telemetry data than teams have ever had to decipher in the past.
Regarding Observability, organizations frequently encounter the following difficulties:
- Data Silos: It is challenging to comprehend the interdependencies across applications, various clouds, and digital channels, including the web, mobile, and IoT, because of the presence of several agents, divergent data sources, and silos monitoring tools.
- Volume, Speed, Varieties, and Complexity: In constantly evolving modern cloud infrastructures like AWS, Azure, and Google Cloud Platform, the sheer volume of raw data generated from every component makes it nearly impossible to find answers (GCP). The ability of Kubernetes and containers to spin up and down quickly demonstrates this as well.
- Lack of pre-production: Despite load testing in pre-production, developers still lack a means of observing or comprehending how real users would affect apps and infrastructure before pushing code into production.
- Wasting time troubleshooting: Teams from the application, operations, infrastructure, development, and digital experience are brought in to troubleshoot and attempt to pinpoint the source of issues. As a result, valuable time is lost making educated guesses and trying to make sense of telemetry.
How Does Observability Relate to DevOps?
In DevOps, Observability is essential to be considered. If you want to take advantage of all the advantages that DevOps offers, Observability is a crucial element. Given that DevOps approaches include consistent project delivery.
DevOps concepts demand CI/CD (Continuous Integration and Continuous Delivery). Knowing whether new changes may disrupt the application is vital! In addition, it enables developers to control activity when distributing products to users.
You can handle this complexity thanks to Observability. First, it enables you to comprehend the application’s internal state by looking at its outputs. Additionally, it locates the issue and establishes when and where it occurred.
How to Get Started with Observability?
To achieve Observability, your systems and applications must be properly equipped to gather the necessary telemetry data. You can create an observable system by creating your own tools, utilizing open-source software, or purchasing a for-profit observability solution.
Here are a few steps on how to get started with Observability:
- Determine your business goals: By reducing infrastructure spending, supporting growth capacity planning, or enhancing crucial business KPIs like mean time to recovery, a robust observability configuration can help increase bottom-line revenue. By giving the support staff additional contextual data, it can promote transparency or even create a positive client experience. However, the observability configuration for each of these objectives can be very different. Create an observability strategy to accomplish your main business goals after identifying them.
- Focus on the right metrics: Instead of responding to problems as they arise, a well-designed observability method enables one to anticipate the commencement of a probable error or failure and then pinpoint the location of its root causes. The pursuit of transparency involves several data collecting and analytics processes and other monitoring and testing technologies.
- Event logs: For architecture and development teams, event logs provide a significant data source on the Observability of distributed systems. Tools designed for event logging, like Prometheus, Middleware, and Splunk, capture and store events. These events could include the successful conclusion of an application procedure, a significant system failure, unanticipated downtime, or traffic influxes that cause overload. Because it offers crucial forensic information for developers to discover flawed components or problematic component interactions, this is particularly crucial for debugging and error handling.
- Accessible data visualizations: Observability data must be compressed into a usable and shareable format when a team has successfully gathered it. This is frequently accomplished by visual representations of that data using various tools. From there, team members can disseminate or share that information with other teams working on the program.
- Choose the right observability platform: When it comes to choosing the right observability platform, please take into consideration the following factors;
– Is the tool free?
– Does the tool use an open-source agent?
– Is it easy to use?
– Do I have the technical knowledge to use the tool to its full potential?
– What’s the amount of data the tool can process?
Answering these and other business-specific questions will help you make an informed decision.
Conclusion
An Observability system needs to be appropriate for its intended platform. In the lack of that, it may either develop into a cumbersome system that drives up operating costs or be unimpressive and offer little visibility. Therefore, the plan must also specify and name the main inquiries the organizational design must make possible.
Without that direction, Observability risks turning into a confusing web of conflicting issues that might not deliver the anticipated coherent and consistent user experience and support.